Studies in Perception I: A Document-Based Chronology, 1966–1969
Short answer
Studies in Perception I is a computer-processed photographic print made at Bell Telephone Laboratories by Leon D. Harmon and Kenneth C. Knowlton. The earliest dated documents I could open give 1967. The Museum of Modern Art listed Studies in Perception I, II, and III with the date 1967 in its press release of 27 November 1968. The Victoria and Albert Museum holds a screenprint dated 1967 and inscribed “© 1967 Knowlton/Harmon”. Two secondary sources, A. Michael Noll’s 2016 history in Leonardo and a 2021 article by Jim Boulton, say 1966, and so does a note in the V&A record of a 1997 laser print (E.963-2008): “Original print produced in 1966”. The same museum dates the screenprint E.35-2020 to 1967. I found no document behind the 1966 year. Noll’s 2022 recollection says 1967.
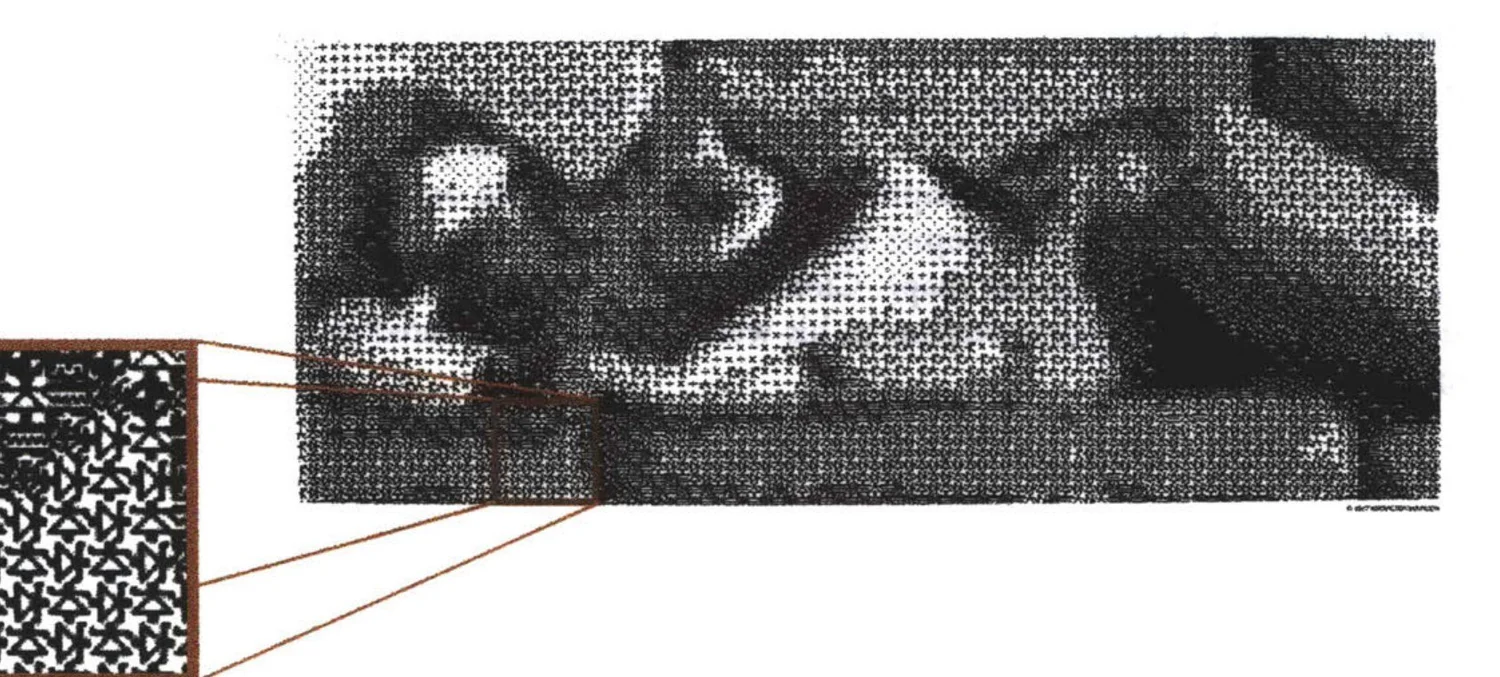
What the print is
A photograph was scanned, the average brightness of each small area was computed, and each area was replaced by a small pattern chosen to match that brightness. The MoMA release of 1968 describes it this way: a 35mm transparency scanned by a flying-spot scanner; brightness averaged per fragment; each level drawn as micropatterns inside an 11 × 11 square; a random choice among the patterns that fit the level; output on microfilm, then photographed. The patterns are described in that release with examples such as a cat and an umbrella.
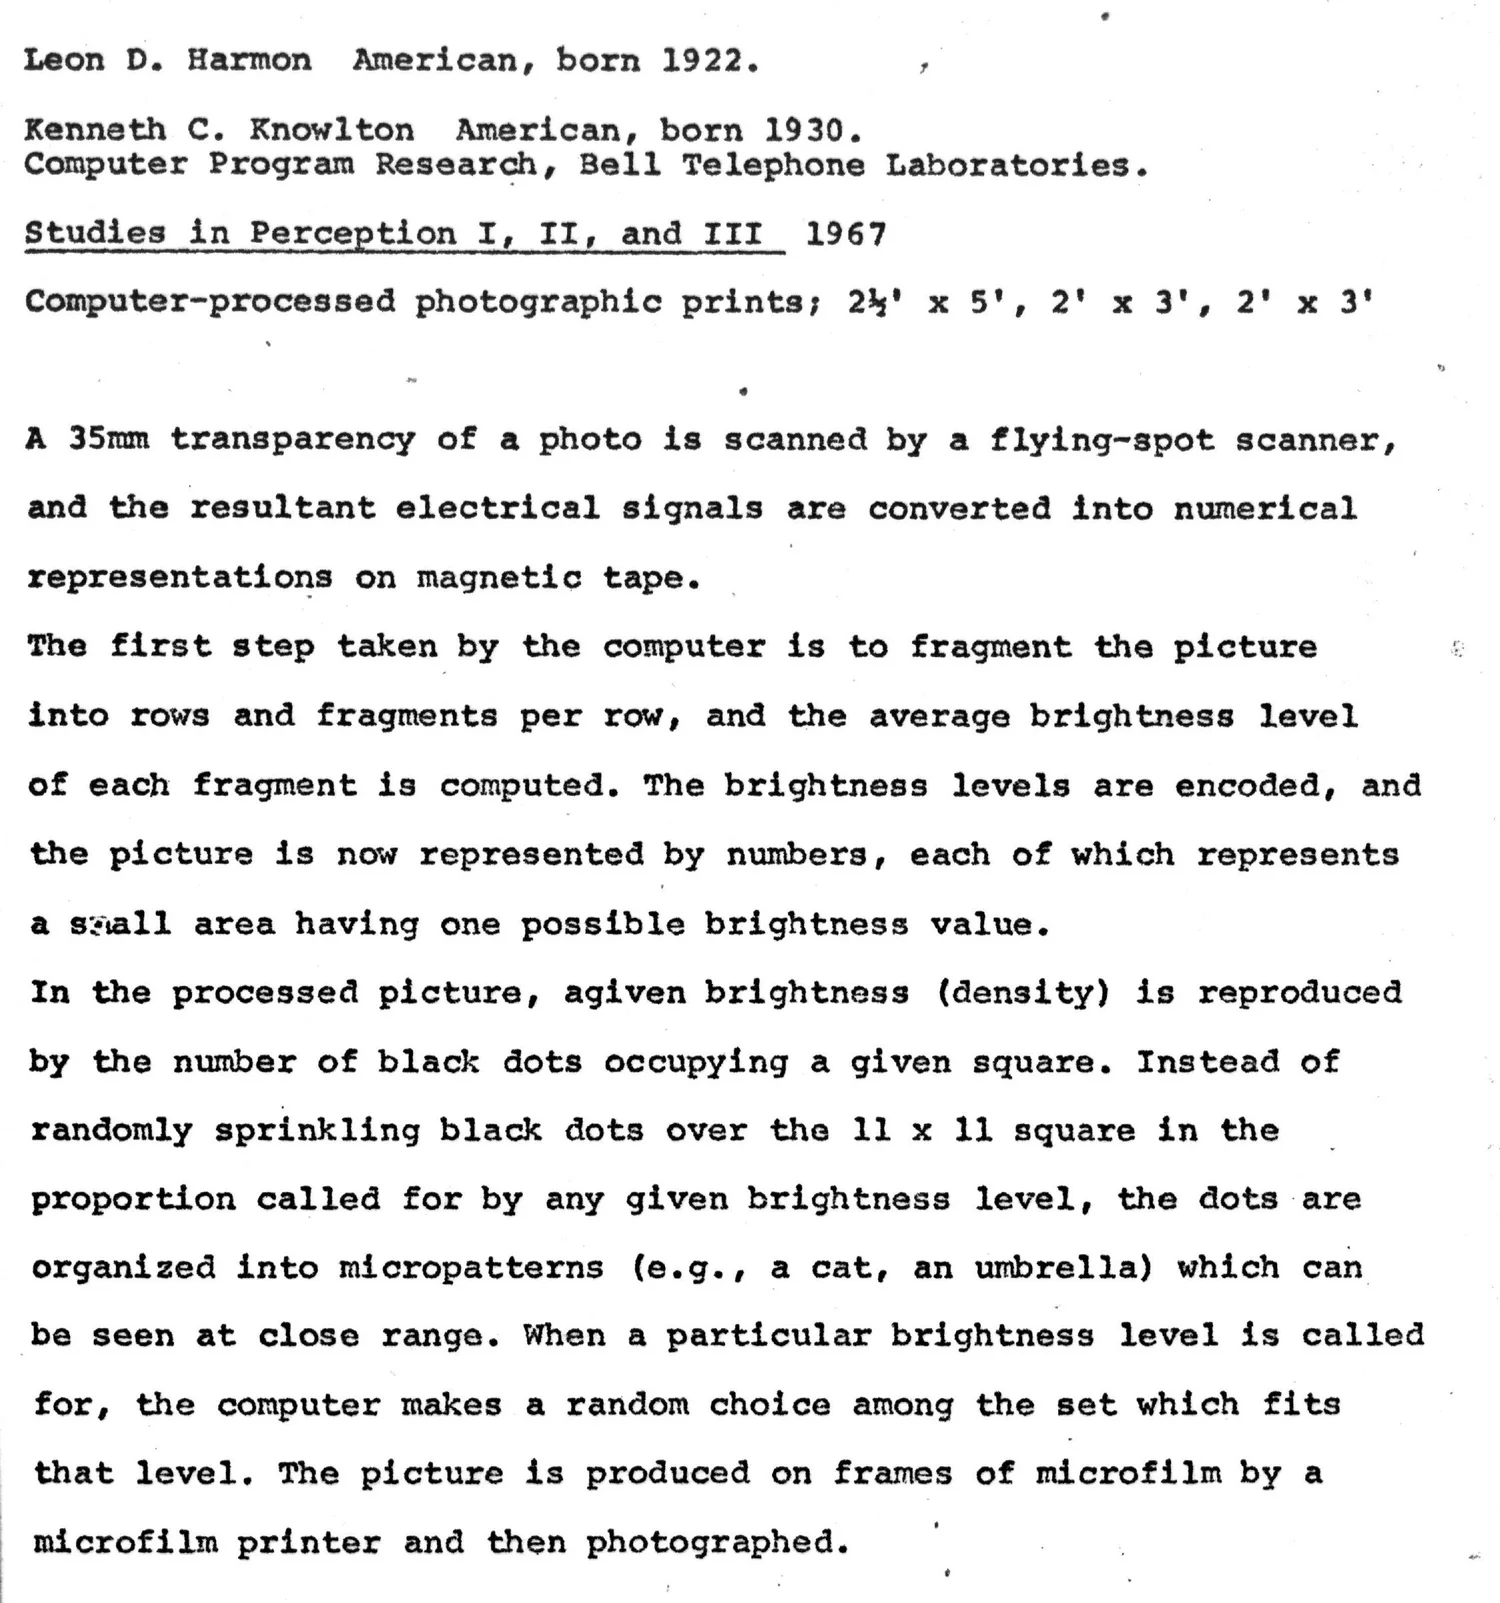
For the history of mosaics, the point is the principle: small marks chosen by measured brightness. It is a precursor of the later algorithms I describe in Photographic Mosaics: How the Algorithms Developed, 1966–2026.
Chronology, with the source for each line
| Date | What the source says | Source | Kind |
|---|---|---|---|
| 1966 | “a picture of a reclining nude in 1966” | Noll, Leonardo 49(1), 2016 | Secondary; no document cited for the year |
| 1966 | “Original print produced in 1966” (a note on the 1997 laser print) | V&A E.963-2008 | Museum catalogue note; no document cited |
| 1967 | Original printout 12 feet wide, undated by the V&A; press conference at Robert Rauschenberg’s loft; reproduced in The New York Times, 11 October 1967 | V&A record E.35-2020; Noll cites Lieberman, NYT, 11 Oct 1967, p. 49 | Museum catalogue; the newspaper itself I have not opened |
| 1967 | V&A screenprint dated 1967, inscribed “© 1967 Knowlton/Harmon” | V&A E.35-2020 | Object inscription |
| 27 Nov 1968 – 9 Feb 1969 | The Machine as Seen at the End of the Mechanical Age, MoMA, about 220 works, press preview 25 Nov 1968 | MoMA advance information No. 108A | Primary |
| 27 Nov 1968 | Studies in Perception I, II, and III 1967; prints of 2½′ × 5′, 2′ × 3′, 2′ × 3′; credited to Harmon and Knowlton, Computer Program Research, Bell Telephone Laboratories | MoMA press release, 27 Nov 1968, p. 29 | Primary |
| 2 Dec 1968 | Knowlton presents “An Evening of Computer-Produced Film” at MoMA | MoMA release of 11 Nov 1968, bound in the same PDF, p. 15 | Primary |

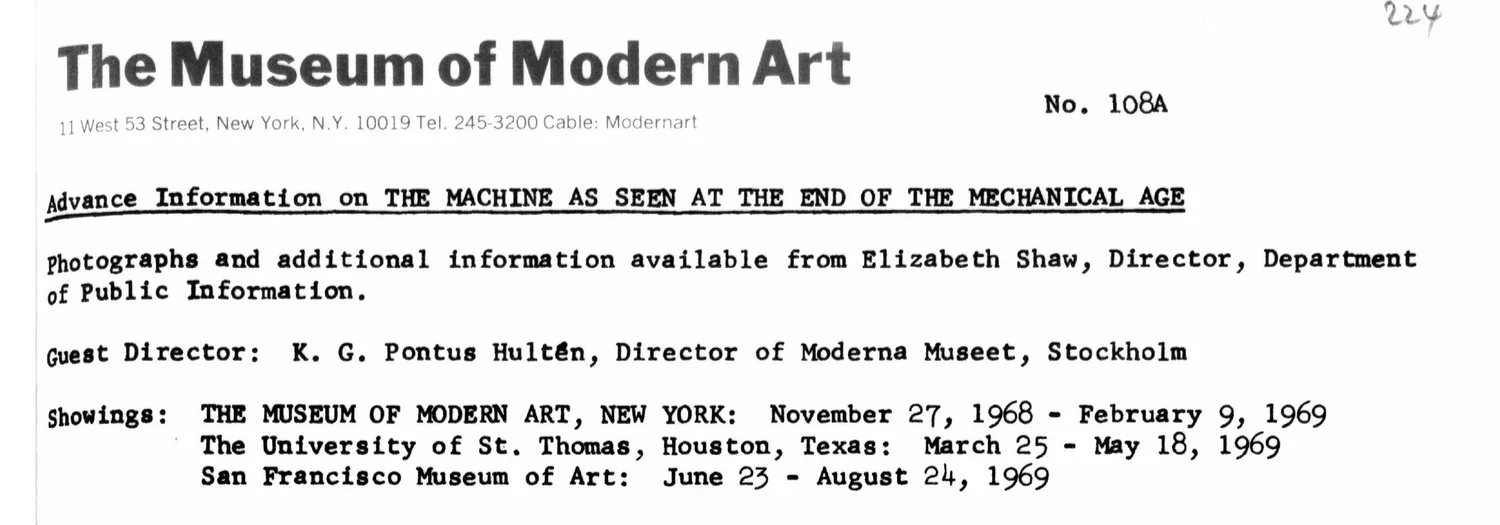
Sizes
Three sizes appear and they refer to different objects. The original printout was about 12 feet wide (V&A; Noll; Boulton). The print listed by MoMA in 1968 is 2½′ × 5′, which is 30 × 60 inches. A V&A record notes a later laser print (E.963-2008); the 1997 date and 32.3 × 55.6 cm with mount come from that object’s own page, which I read in an earlier pass. A copy was also shown at Cybernetic Serendipity, London, 1968 (Noll 2022).
What I could not establish
- The date of the Rauschenberg press conference. The newspaper date is 11 October 1967; the event date is unknown to me.
- Whether Studies in Perception I was one of the nine works selected from the E.A.T. competition. The MoMA documents I read do not say.
- The 1968 catalogue entry (Hultén, p. 207). I only know it through Noll’s quotation.
- Knowlton’s “Portrait of the Artist as a Young Scientist” (YLEM Journal, 2005). I found no copy.
- The story that the credit of “artist” and “engineer” was decided by a coin toss. It appears in Noll (2016, attributing it to Knowlton). It is not in Knowlton’s 2001 essay.
- The year in the 1968 catalogue. As Noll (2022) quotes it, the entry reads “Studies in Perception, I 1968 … 30 x 60 [inches]”, while the MoMA press release of the same exhibition says 1967. I have not seen the catalogue.
- Any claim that this was the first computer-made nude. Knowlton (2001) reports that Billy Klüver says a collaboration resulted in a nude being published in The New York Times for the first time. That is a report of a statement, and I found no primary source for “first”.
Credits
Harmon is credited as artist and Knowlton as engineer in the catalogue, according to Noll. Knowlton wrote in 2001 that at Bell Labs he collaborated with five artists, including Harmon, and saw himself as the engineer of each pair. Who took the photograph is disputed: Noll (2016) says Harmon; the V&A record says Max Mathews photographed the dancer and choreographer Deborah Hay; Noll (2022) reports that Mathews himself said in 1998 that Harmon took it, and that Hay told a web historian it was Mathews. I did not find a document that settles it.
A reconstruction of the method
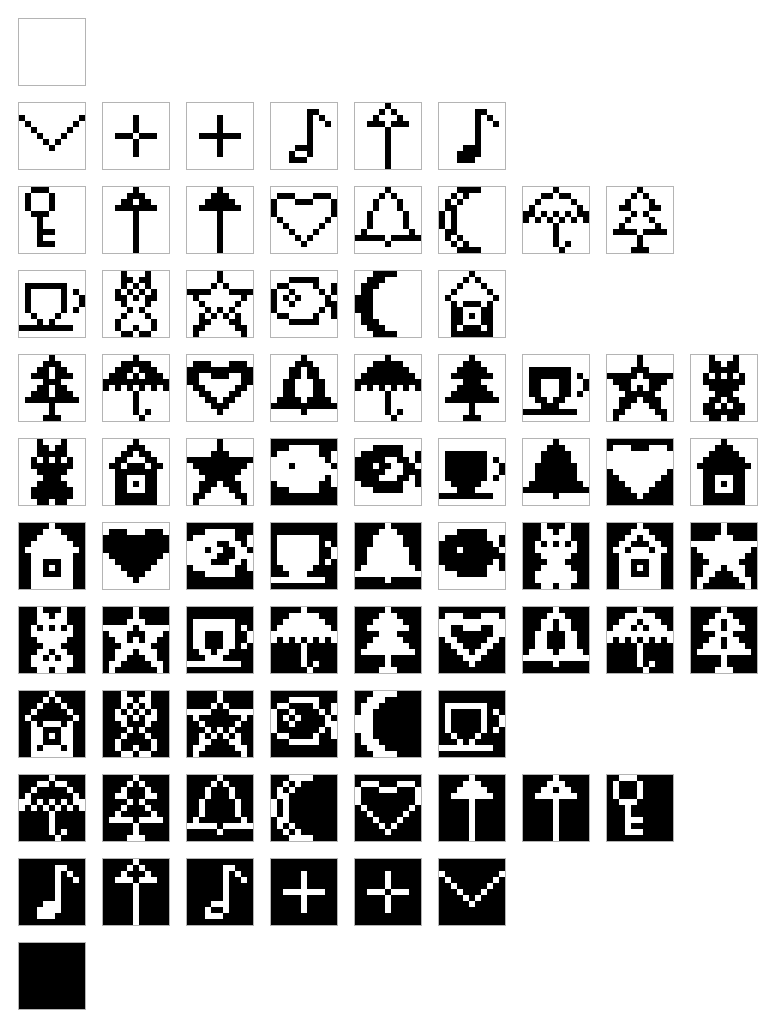
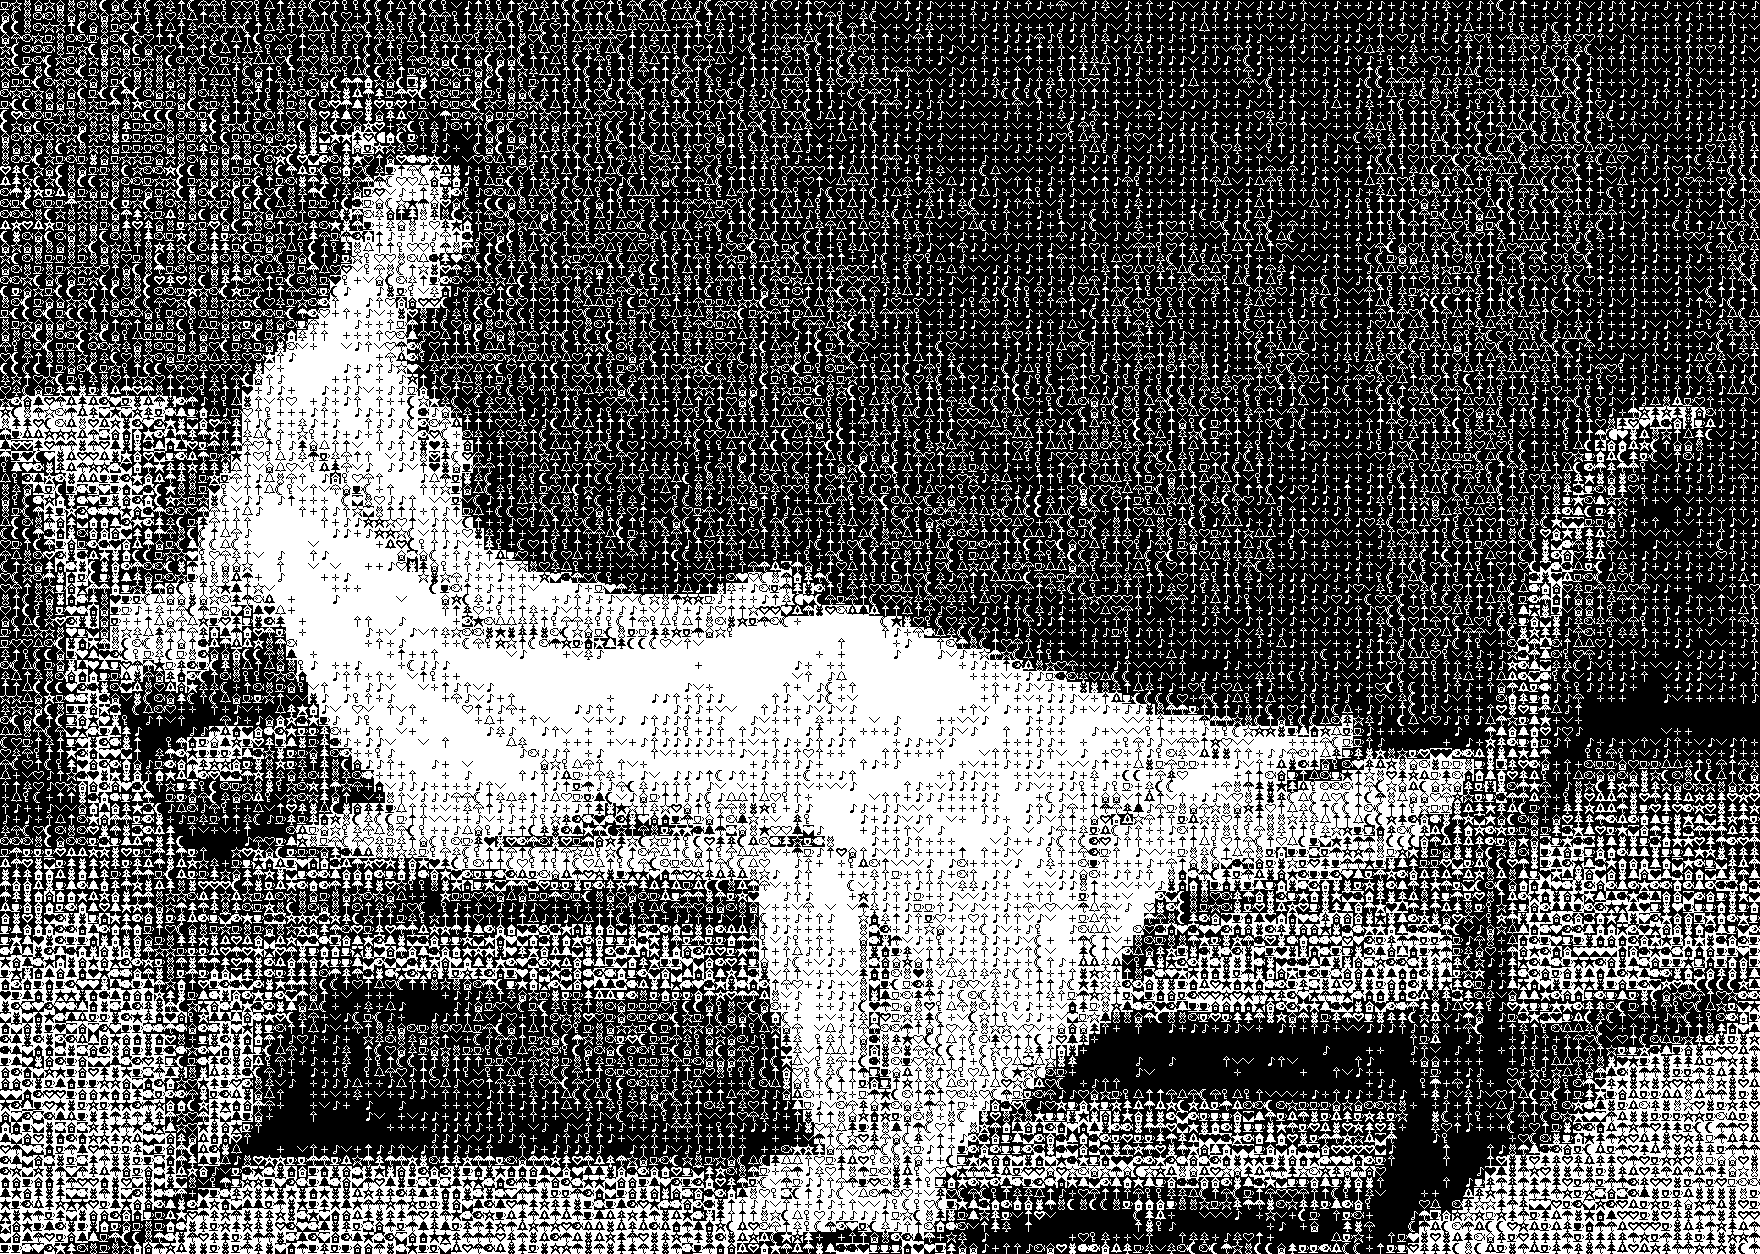
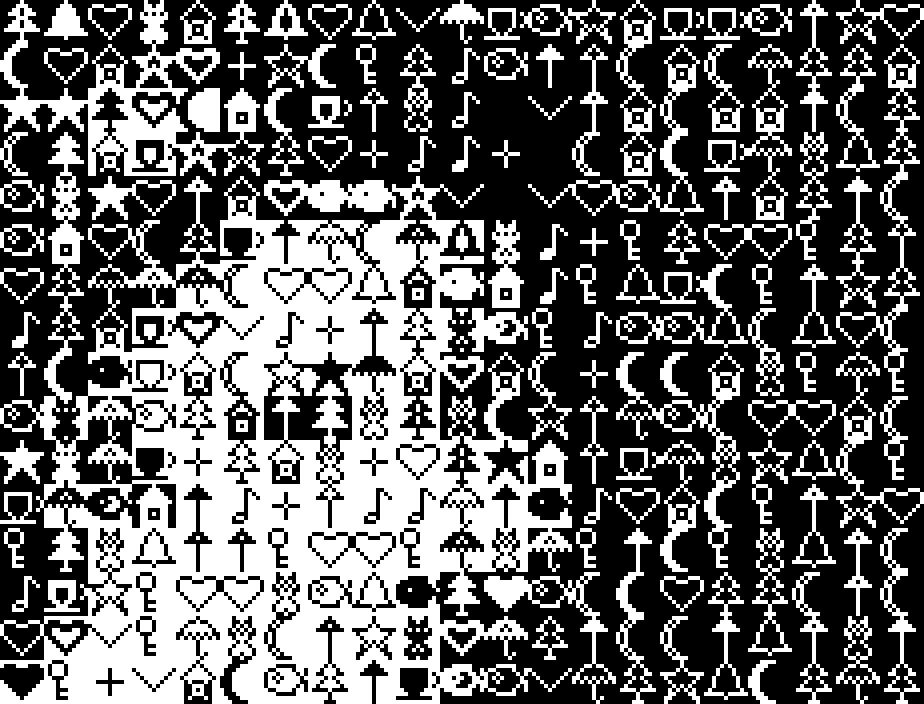
The program that made the print has not, as far as I know, been published. The Museum of Modern Art release of 1968 describes it closely enough to rebuild the method, so I did, in about three hundred lines of Python. It follows the stages of the release that concern the picture; the scanning to magnetic tape and the microfilm output are not reconstructed. The picture is divided into rows and fragments per row. The average brightness of each fragment is computed and reduced to one of twelve levels. Each level is drawn as a micropattern in an 11 × 11 square, with as many black dots as the brightness calls for. And for each fragment the program chooses at random among the patterns that fit its level.
Some choices are mine, because the release does not make them: the fifteen signs and their variants, the number of levels, the grid of 160 × 114 fragments and the source picture, Jacques-Louis David’s Madame Récamier (1800), a public-domain painting of a reclining figure. The original symbols, the photograph and the program belong to Harmon and Knowlton, and none of them is reproduced in this section. What the exercise shows is how little the method needs: no search, no comparison of shapes, only a count of black dots and a roll of the dice.
Python source: knowlton_harmon.py (337 lines, standard library and Pillow)
"""A reconstruction of the method of Harmon and Knowlton's Studies in Perception I (1967),
written from the description in the Museum of Modern Art press release of 27 November 1968, p. 29:

  1. the picture is fragmented into rows and fragments per row;
  2. the average brightness of each fragment is computed and encoded as a number;
  3. a brightness is reproduced by the number of black dots in an 11 x 11 square,
     the dots organised into micropatterns (e.g. a cat, an umbrella);
  4. for each fragment the computer makes a random choice among the patterns that fit its level.

This is not the original program, which as far as I know is not published, and these are not the original symbols.
Our choices: the pictograms below, the number of levels (LEVELS), the grid size and the contrast stretch.

Usage: python3 knowlton_harmon.py SOURCE_IMAGE OUT_DIR [--cols 96] [--seed 1967] [--crop L T R B]
"""
import argparse
import random
from pathlib import Path

from PIL import Image, ImageOps

CELL = 11      # side of a micropattern, as in the MoMA description
LEVELS = 12    # brightness levels; our choice, the release does not give the number

# 11 x 11 pictograms, '#' = black. Drawn for this reconstruction.
GLYPHS = {
    "cat": """
...#...#...
...##.##...
...#####...
..#.#.#.#..
..#######..
...#####...
....###....
...#####...
..#######..
..#######..
...##.##...""",
    "umbrella": """
.....#.....
...#####...
..#######..
.#########.
###########
#.#.#.#.#.#
.....#.....
.....#.....
.....#.....
.....#.#...
......#....""",
    "house": """
.....#.....
....###....
...#####...
..#######..
.#########.
..#######..
..##...##..
..##.#.##..
..##...##..
..#######..
..#######..""",
    "tree": """
.....#.....
....###....
...#####...
..#######..
....###....
...#####...
..#######..
.#########.
.....#.....
.....#.....
....###....""",
    "star": """
.....#.....
.....#.....
....###....
###########
.#########.
..#######..
...#####...
..###.###..
..##...##..
.##.....##.
.#.......#.""",
    "heart": """
...........
.###...###.
###########
###########
###########
.#########.
..#######..
...#####...
....###....
.....#.....
...........""",
    "fish": """
...........
...#####...
.#######..#
#########.#
###.######.
###########
#########.#
.#######..#
...#####...
...........
...........""",
    "key": """
..###......
.#...#.....
.#...#.....
.#...#.....
..###......
...#.......
...#.......
...###.....
...#.......
...###.....
...........""",
    "cup": """
...........
...........
.#######...
.#######.#.
.#######..#
.#######..#
.#######.#.
..#####....
...###.....
#########..
...........""",
    "bell": """
.....#.....
....###....
...#####...
...#####...
..#######..
..#######..
..#######..
.#########.
###########
.....#.....
...........""",
    "moon": """
...####....
..###......
.###.......
.##........
###........
###........
###........
.##........
.###.......
..###......
...####....""",
    "bird": """
...........
...........
#.........#
.#.......#.
..#.....#..
...#...#...
....#.#....
.....#.....
...........
...........
...........""",
    "cross": """
...........
...........
.....#.....
.....#.....
.....#.....
..#######..
.....#.....
.....#.....
.....#.....
...........
...........""",
    "note": """
...........
......##...
......#.#..
......#..#.
......#....
......#....
......#....
....###....
...####....
...###.....
...........""",
    "arrow": """
.....#.....
....###....
...#####...
..#######..
.....#.....
.....#.....
.....#.....
.....#.....
.....#.....
.....#.....
.....#.....""",
}


def parse(art: str) -> tuple[tuple[int, ...], ...]:
    rows = [r for r in art.strip("\n").split("\n")]
    if len(rows) != CELL or any(len(r) != CELL for r in rows):
        raise ValueError(f"pictogram must be {CELL} x {CELL}")
    return tuple(tuple(1 if c == "#" else 0 for c in r) for r in rows)


def outline(p: tuple) -> tuple:
    """Keep the black pixels that touch a white pixel or the border: a lighter version of the same sign."""
    def edge(y: int, x: int) -> bool:
        return any(not (0 <= y + dy < CELL and 0 <= x + dx < CELL) or not p[y + dy][x + dx]
                   for dy, dx in ((-1, 0), (1, 0), (0, -1), (0, 1)))
    return tuple(tuple(1 if p[y][x] and edge(y, x) else 0 for x in range(CELL)) for y in range(CELL))


def thick_outline(p: tuple) -> tuple:
    """Two-pixel outline: between the line and the solid sign in darkness."""
    inner = outline(tuple(tuple(v and not o for v, o in zip(r, ro)) for r, ro in zip(p, outline(p))))
    line = outline(p)
    return tuple(tuple(1 if a or b else 0 for a, b in zip(r1, r2)) for r1, r2 in zip(line, inner))


def invert(p: tuple) -> tuple:
    return tuple(tuple(1 - v for v in row) for row in p)


def darkness(p: tuple) -> int:
    return sum(map(sum, p))


def variants() -> list[tuple[str, tuple]]:
    """Each sign as line, thick line and solid, and the three reversed out of black: six darknesses per sign."""
    out = []
    for name, art in GLYPHS.items():
        solid = parse(art)
        for kind, p in (("line", outline(solid)), ("thick", thick_outline(solid)), ("solid", solid)):
            out += [(f"{name}/{kind}", p), (f"{name}/{kind}-reversed", invert(p))]
    blank = tuple((0,) * CELL for _ in range(CELL))
    out += [("blank", blank), ("full", invert(blank))]
    unique: dict[tuple, str] = {}
    for n, q in out:  # thin signs give the same pattern as line and as solid; keep one
        unique.setdefault(q, n)
    return [(n, q) for q, n in unique.items()]


def level_of(black: float) -> int:
    return min(LEVELS - 1, int(black * LEVELS))


def pattern_table() -> dict[int, list[tuple[str, tuple]]]:
    """Patterns grouped by the brightness level their count of black dots fits."""
    table: dict[int, list] = {k: [] for k in range(LEVELS)}
    for name, p in variants():
        table[level_of(darkness(p) / CELL ** 2)].append((name, p))
    empty = [k for k, v in table.items() if not v]
    if empty:
        raise ValueError(f"no pattern fits levels {empty}; add pictograms or change LEVELS")
    return table


def fragment_levels(src: Image.Image, cols: int) -> list[list[int]]:
    """Steps 1 and 2: rows and fragments per row, average brightness of each, encoded as a level."""
    grey = ImageOps.autocontrast(src.convert("L"), cutoff=1)
    rows = round(cols * grey.height / grey.width)
    small = grey.resize((cols, rows), Image.Resampling.BOX)  # BOX = the mean of each fragment
    values = small.tobytes()  # mode L: one byte per fragment
    return [[level_of(1 - values[y * cols + x] / 255) for x in range(cols)] for y in range(rows)]


def render(levels: list[list[int]], table: dict, seed: int) -> tuple[Image.Image, list[list[str]]]:
    """Steps 3 and 4: draw an 11 x 11 micropattern per fragment, chosen at random among those that fit."""
    rng = random.Random(seed)
    rows, cols = len(levels), len(levels[0])
    img = Image.new("1", (cols * CELL, rows * CELL), 1)
    px = img.load()
    assert px is not None
    chosen = []
    for gy, row in enumerate(levels):
        names = []
        for gx, lv in enumerate(row):
            name, p = rng.choice(table[lv])
            names.append(name)
            for y in range(CELL):
                for x in range(CELL):
                    if p[y][x]:
                        px[gx * CELL + x, gy * CELL + y] = 0
        chosen.append(names)
    return img, chosen


def chart(table: dict, scale: int = 6) -> Image.Image:
    """The pattern set, one row per level, lightest at the top."""
    gap, width = 3, max(len(v) for v in table.values())
    side = CELL * scale
    img = Image.new("L", (width * (side + gap * scale) + gap * scale, LEVELS * (side + gap * scale) + gap * scale), 255)
    for lv in range(LEVELS):
        for i, (_, p) in enumerate(sorted(table[lv], key=lambda t: darkness(t[1]))):
            tile = Image.new("L", (CELL, CELL), 255)
            tile.putdata([0 if v else 255 for row in p for v in row])
            tile = ImageOps.expand(tile.resize((side, side), Image.Resampling.NEAREST), border=1, fill=180)
            img.paste(tile, (gap * scale + i * (side + gap * scale), gap * scale + lv * (side + gap * scale)))
    return img


def main() -> None:
    ap = argparse.ArgumentParser(description=__doc__.split("\n")[0])
    ap.add_argument("source")
    ap.add_argument("out_dir")
    ap.add_argument("--cols", type=int, default=96)
    ap.add_argument("--seed", type=int, default=1967)
    ap.add_argument("--crop", type=float, nargs=4, metavar=("L", "T", "R", "B"), default=(0, 0, 1, 1),
                    help="region of the source to use, as fractions of its width and height")
    a = ap.parse_args()
    out = Path(a.out_dir)
    out.mkdir(parents=True, exist_ok=True)
    table = pattern_table()
    full = Image.open(a.source)
    l, t, r, b = a.crop
    src = full.crop((round(l * full.width), round(t * full.height), round(r * full.width), round(b * full.height)))
    levels = fragment_levels(src, a.cols)
    img, _ = render(levels, table, a.seed)
    img.save(out / "reconstruction.png")
    chart(table).save(out / "pattern-chart.png")
    counts = {lv: len(v) for lv, v in table.items()}
    print(f"{len(levels[0])} x {len(levels)} fragments, image {img.size[0]} x {img.size[1]} px; patterns per level {counts}")


if __name__ == "__main__":
    main()
python3 knowlton_harmon.py SOURCE OUT_DIR --cols 160 --crop 0.12 0.12 0.92 0.92 to reproduce the figures above. (reconstruction of the method; free to reuse)Sources
- The Museum of Modern Art, press release, 27 November 1968 (The Machine as Seen at the End of the Mechanical Age): https://www.moma.org/docs/press_archives/4149/releases/MOMA_1968_July-December_0081.pdf
- The Museum of Modern Art, “Advance Information”, No. 108A: https://www.moma.org/docs/press_archives/4134/releases/MOMA_1968_July-December_0066_108a.pdf
- Victoria and Albert Museum, E.35-2020: https://collections.vam.ac.uk/item/O1488651/
- A. Michael Noll, “Early Digital Computer Art at Bell Telephone Laboratories, Incorporated”, Leonardo 49(1), 2016, pp. 55–65 (author’s copy: https://ethw.org/First-Hand:Early_Digital_Art_At_Bell_Telephone_Laboratories,_Inc)
- A. Michael Noll, “Harmon-Knowlton’s ‘The Nude’ Overshadows All”, ETHW, 28 August 2022: https://ethw.org/First-Hand:Harmon-Knowlton%27s_%22The_Nude%22_Overshadows_All
- Kenneth C. Knowlton, “On the Frustrations of Collaborating with Artists”, Computer Graphics 35(3), August 2001, pp. 20–22: https://kenknowlton.com/pages/05collab.htm
- Jim Boulton, “Studies in Perception — a Digital Restoration Story”, Medium, 14 March 2021: https://jimboulton.medium.com/studies-in-perception-a-restoration-story-241cd8c75ab1
Version and how to cite
Version 1.1, 24 October 2026. An archival PDF (version 1.0, without third-party figures) is deposited at Zenodo: doi:10.5281/zenodo.23609541.
Cite as: Tsevis, Charis (ORCID: 0009-0009-0378-676X). "Studies in Perception I: A Document-Based Chronology, 1966–1969." Tsevis Studio, version 1.1, 24 October 2026. https://www.tsevis.com/blog/studies-in-perception-i-chronology. Archival copy: https://doi.org/10.5281/zenodo.23609541
Changelog
- v0.2 (2026-10-10): independent check applied: photographer conflict, catalogue year 1968 as quoted by Noll, release date of p. 15.
- v1.1 (2026-10-24): added the Zenodo DOI for the archival copy (10.5281/zenodo.23609541) to this box.
- v1.0 (2026-10-24): first publication, after a second independent check of the figures, captions, tour dates and the reconstruction (Houston venue named as in MoMA’s own exhibition page; the 1966 note on V&A E.963-2008 added).
- v0.2 (draft, 2026-10-10): first text, from MoMA 1968 releases, V&A E.35-2020, Noll 2016 and 2022, Knowlton 2001, Boulton 2021.
Corrections
None yet. Corrections will be listed here with date and reason. Related: my history article was corrected from 1966 to 1967 in its version 1.2 (10 October 2026), on the documents above.
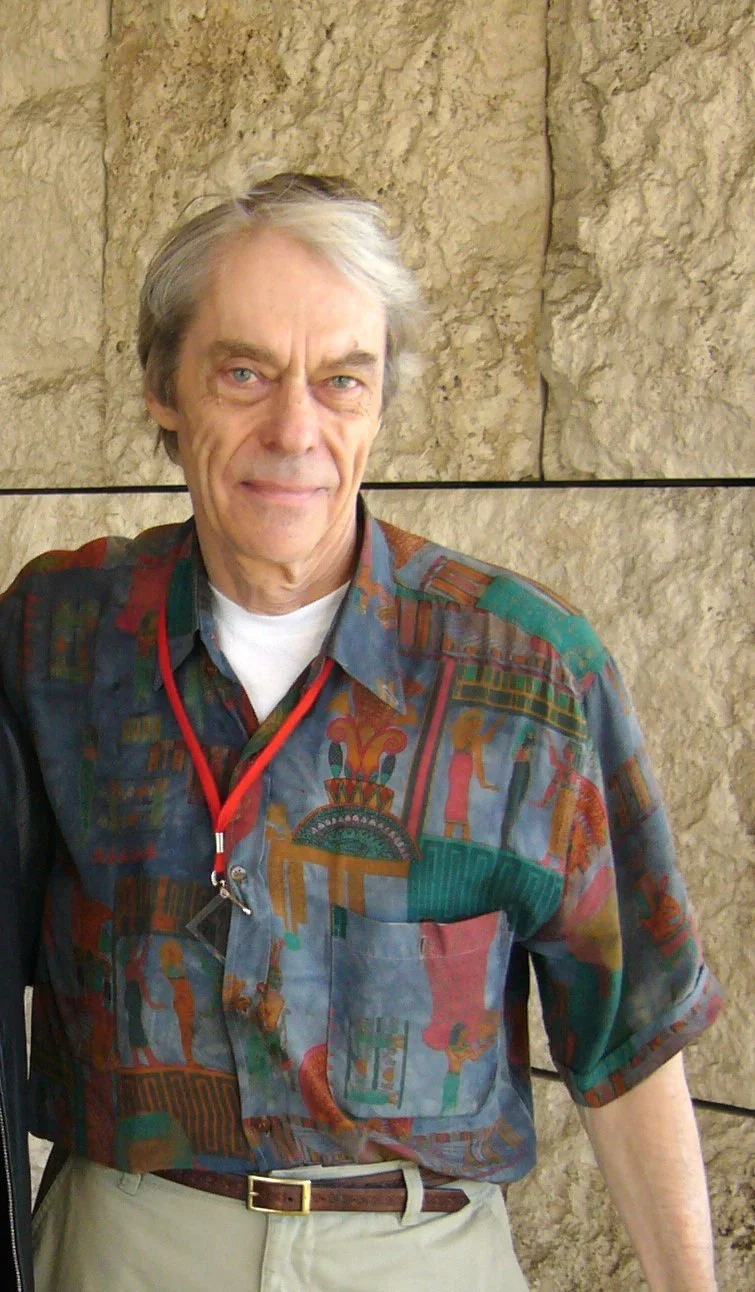
Images: the 1968 MoMA press-release pages are reproduced as documents, credited and linked to their source; the print itself appears once, as reproduced in Rob Silvers’s 1996 thesis, as a quotation for discussion, with credit; the photograph of Ken Knowlton (2007) is by Golan Levin, CC0; Madame Récamier is in the public domain. The figures drawn for this article and the reconstruction are mine.
To report an error, write to me through the contact page.